There is one question that can freeze a busy owner or team lead in their tracks: “So, when will it be done?” A client asks it on a call. Your boss drops it into a message at 4:55 on a Friday. And somewhere in your chest, a little panic starts, because the honest answer is usually “I have no idea” – so instead you pluck a number out of the air, say “end of the month,” and immediately start dreading it. We have all done it. The trouble is that a made-up date is a promise you had no business making.
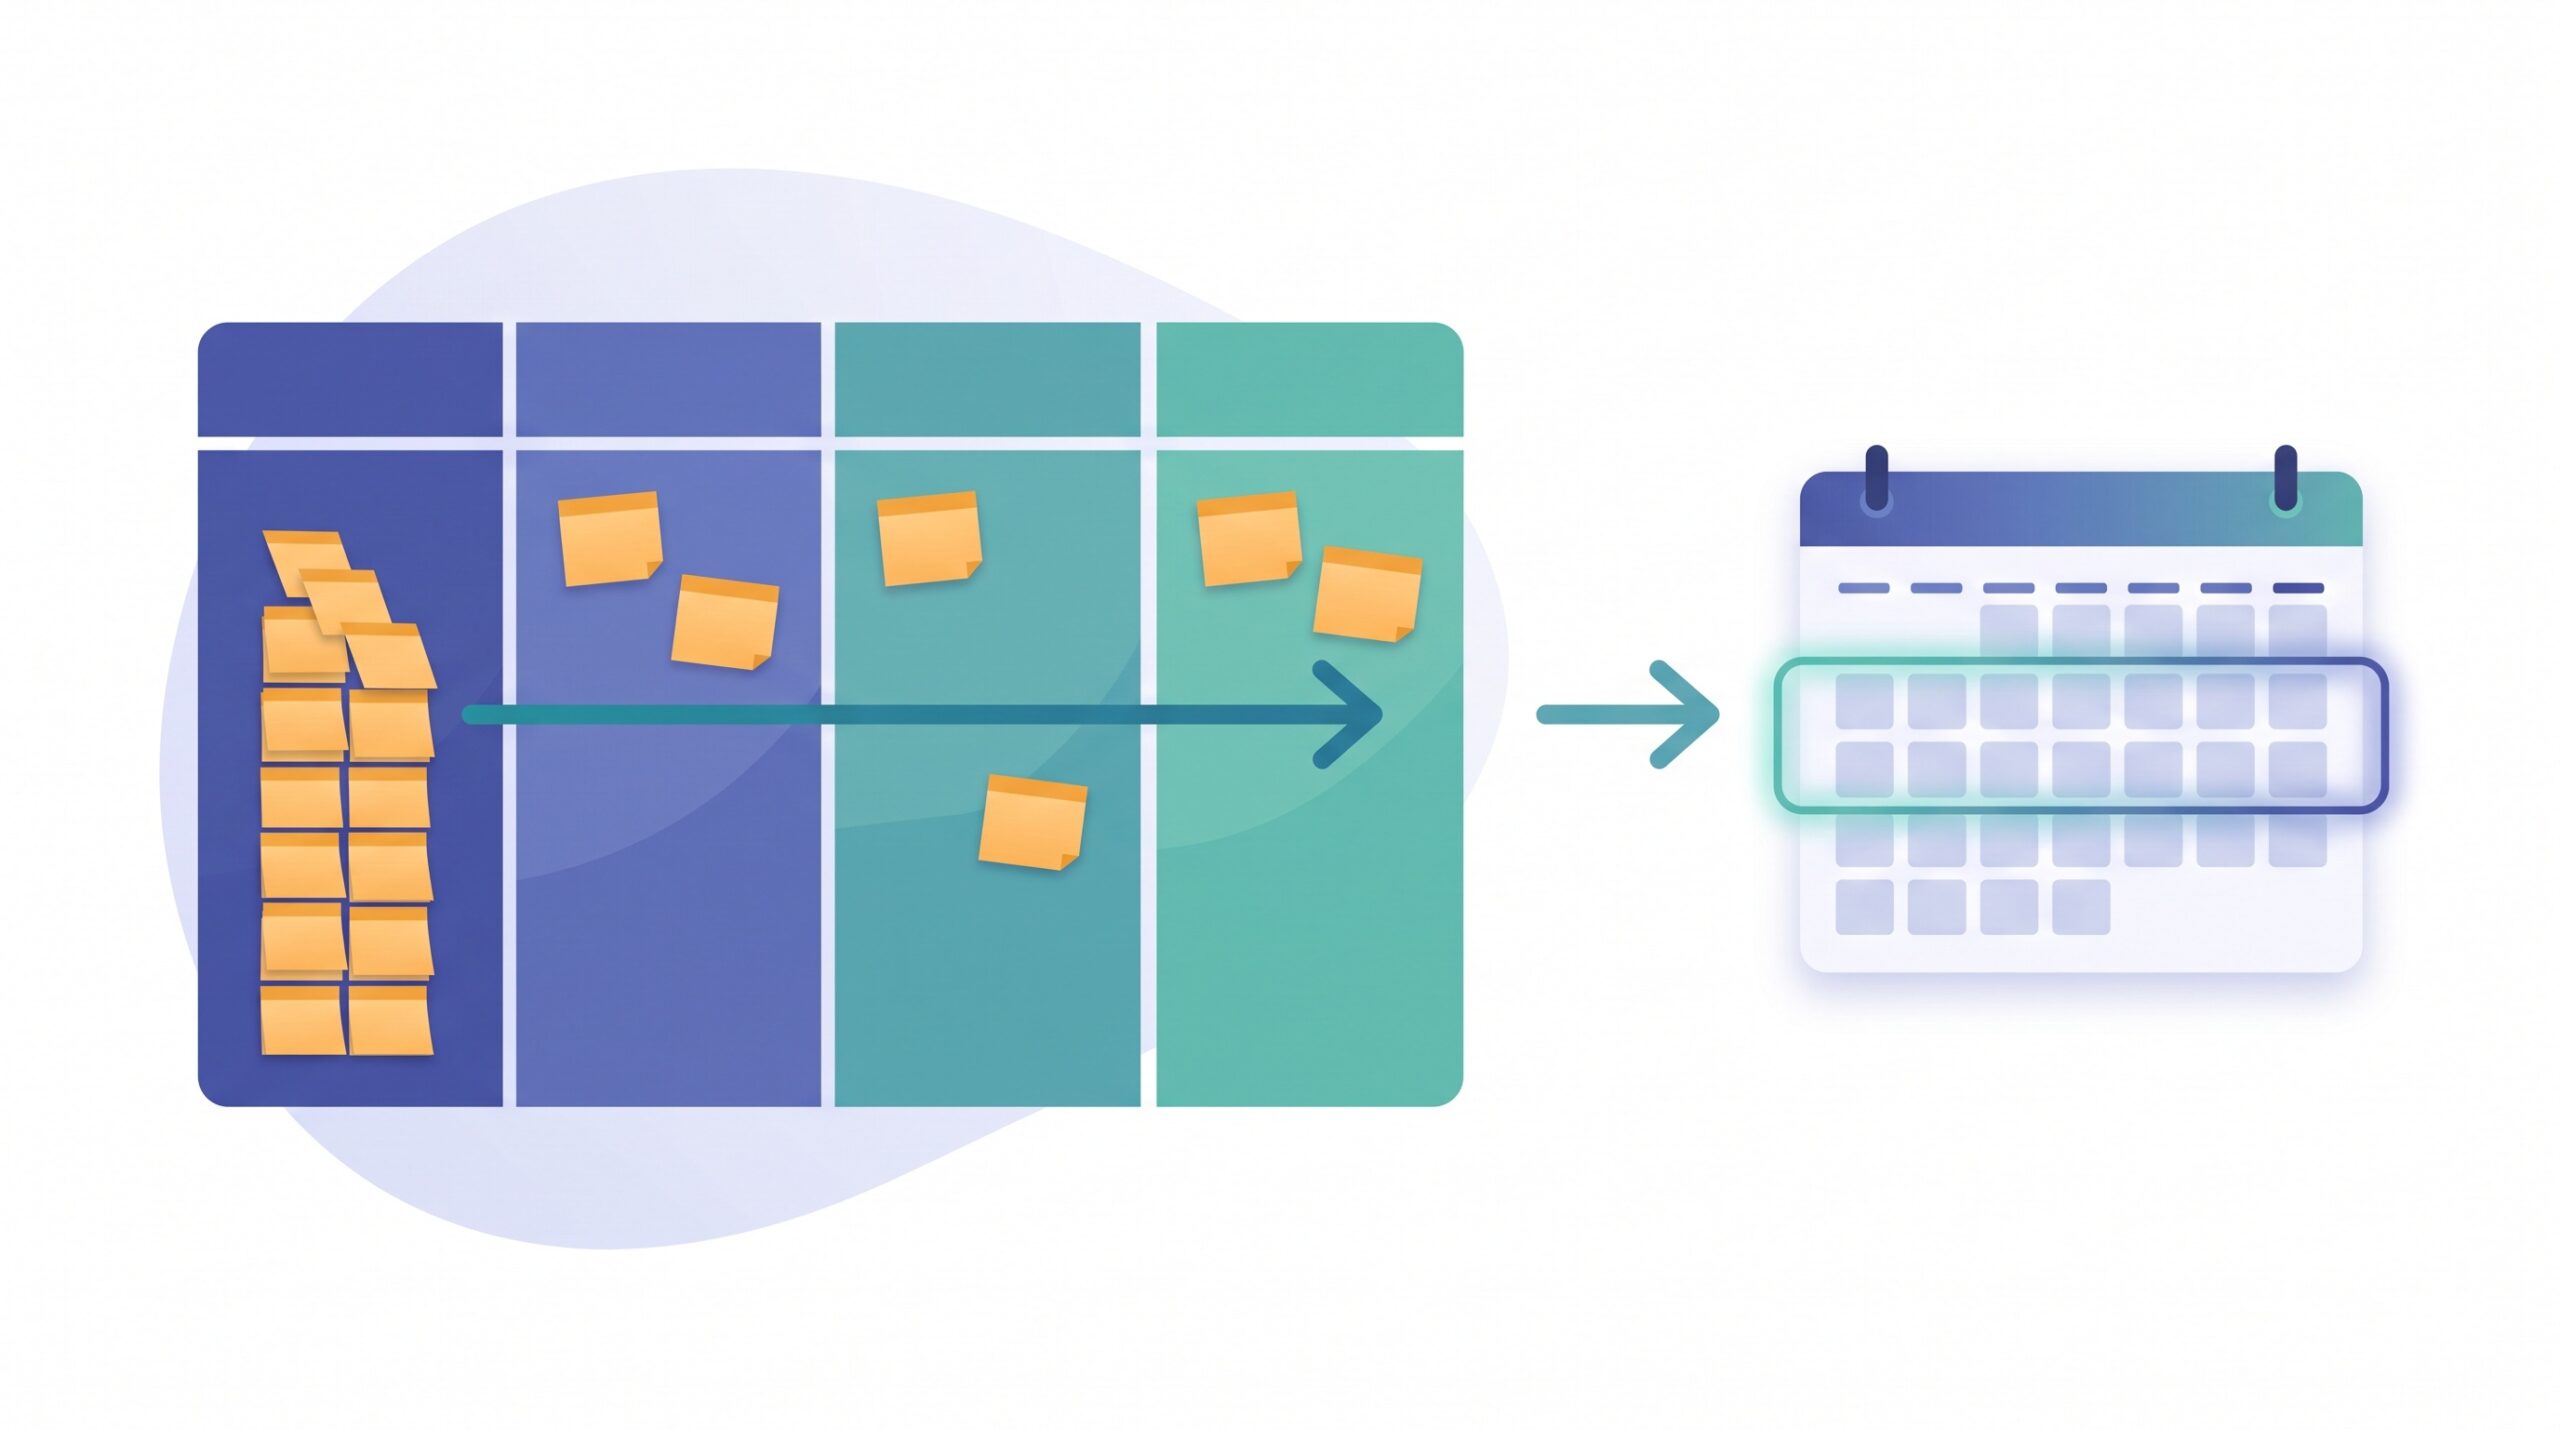
Here is the good news, and it is genuinely good: you do not need story points, planning poker, velocity charts, or a half-day estimation meeting to answer that question well. If you run your work on a board, you are already sitting on the one piece of data that actually predicts delivery. You just have to start counting it. This is forecasting the simple way – from what your team really does, not from what everyone hopes they might do.
Why estimates quietly let you down
Traditional estimating asks a very human question – “how long do you think this will take?” – and human answers to that question are famously optimistic. We picture the smooth version: no interruptions, no sick days, no client changing their mind, no urgent fire on Tuesday. Reality includes all of those, so the estimate is wrong before the ink dries. Add ten more tasks, each individually “a day or two,” and the small optimisms compound into a schedule that was never going to hold.
Estimates also cost you time to produce, and that time buys surprisingly little. A team can spend an hour debating whether a task is a three or a five, and still miss the deadline by two weeks – because the thing that actually sank them was not the size of any single task, it was how much other work was competing for the same people. Guessing harder does not fix that. Counting does.
The one number that predicts delivery: throughput
Forget effort for a moment and look at output. Throughput is simply the number of work items your team finishes in a stretch of time – cards moved to “done” per week, say. That is it. Not how big they were, not how hard they felt. Just how many crossed the line. It sounds too blunt to be useful, and yet over a few weeks it becomes the most reliable predictor you have, because it already bakes in all the interruptions, the meetings, and the bad Tuesdays. Your real pace, not your hoped-for pace.
To find it, look back at your board’s recent history and count. If your team finished 6 cards two weeks ago, 4 last week, and 5 this week, your throughput is running at roughly 5 cards a week. You do not need a tool for this – a note on the whiteboard each Friday will do. This is a close cousin of the cycle time and lead time you may already be tracking; where those tell you how long one card takes, throughput tells you how many cards clear per week, which is exactly what you need to project a finish line.

The forecast, on the back of a napkin
Once you have throughput, the forecast is arithmetic a ten-year-old can do. Count the cards remaining for the thing you care about – the project, the client deliverable, the feature. Divide by your weekly throughput. That is roughly how many weeks are left.
Say a client project has 20 cards still to finish, and your team reliably completes about 5 a week. Twenty divided by five is four – so you are looking at roughly four weeks, landing near the end of the month. Notice what just happened: you gave a real answer, grounded in what your team actually delivers, in about thirty seconds and without a single guess about how “hard” anything is. If new work gets discovered mid-project (and it always does), you add those cards to the count and the date moves honestly, in plain view, instead of blowing up as a nasty surprise at the end.
Give a range, not a single date
Now for the part that separates a lucky guess from a trustworthy forecast: never hand over one exact date. Your throughput is not a fixed 5 every week – it was 4, then 6, then 5. Good weeks and bad weeks are real, so your forecast should carry that honesty inside it. Instead of a razor-thin “the 28th,” give a range built from your own recent pace.
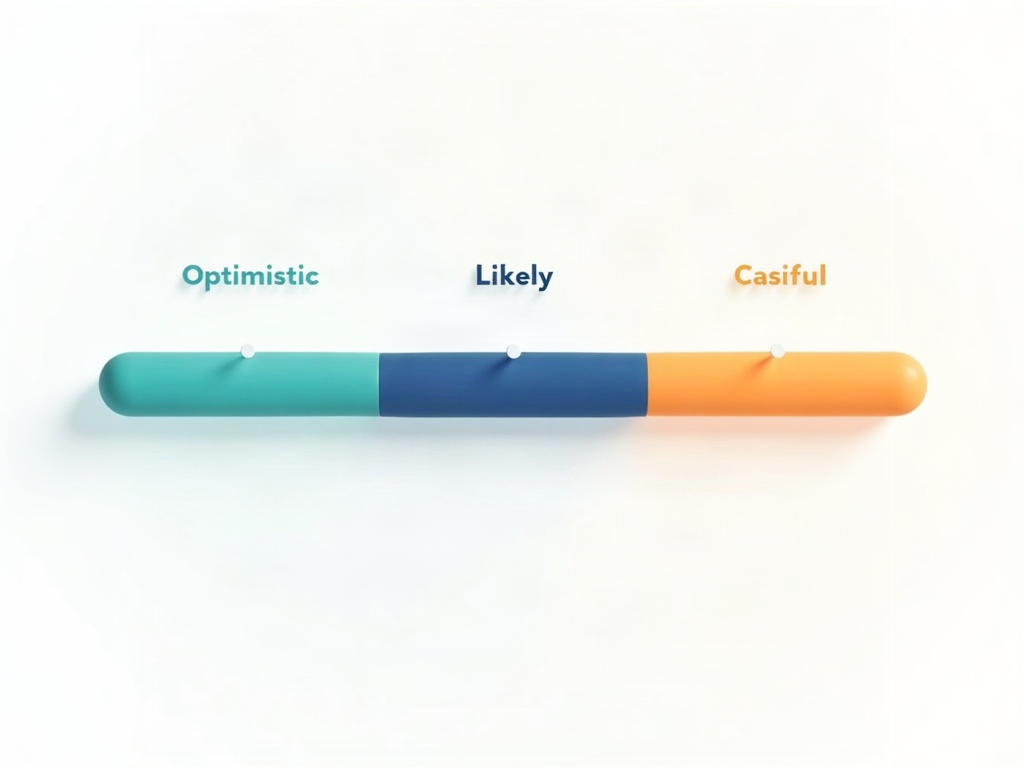
It is easier than it sounds. Use your slow weeks for the cautious end and your good weeks for the optimistic end. With 20 cards left: at a rough 4-per-week pace you land in about five weeks; at 6-per-week you land in about three. So you say “three to five weeks, most likely four.” That range is not you being wishy-washy – it is you being accurate. A single date pretends to a certainty nobody has; a range tells the truth and still gives the person a clear window to plan around. When you deliver inside it, you look reliable. When you keep hitting made-up single dates by luck, you are one bad week away from looking like you cannot be trusted.
Keep the forecast honest
A throughput forecast is only as steady as the work feeding it, so a couple of small habits keep it trustworthy. The biggest one is card size. If your cards range from “twenty minutes” to “three weeks,” then counting them is nearly meaningless – finishing five tiny cards is nothing like finishing five monsters. Break big items down so your cards are roughly in the same ballpark. This is the quiet value of right-sizing your cards: consistent-sized work makes “count and divide” actually mean something.

The second habit is to watch how much you start at once. When a team juggles too many things in parallel, everything slows and throughput sags – which quietly pushes every forecast out. Keeping a lid on work in progress is the fix, and it is the same discipline behind healthy WIP limits. Finish more, start less, and your completion rate steadies – which makes your forecasts sharper. If you want a visual gut-check that your pace is holding, a cumulative flow diagram shows at a glance whether your done line is climbing at a steady, forecastable angle or stalling out.
What to actually say when they ask
So the next time that message lands – “when will it be done?” – you have a real answer and a calm way to give it. Glance at the board, count what is left, divide by your recent weekly pace, and offer a range: “Based on how much we’ve been finishing lately, I’d say three to five weeks – most likely four. I’ll flag you the moment that shifts.” You sound measured because you are. You are not promising; you are forecasting, and you can back it up.

That last line matters too. Because your forecast comes from live data, you will see slippage early – the count is climbing, or a couple of slow weeks are dragging the pace down – and you can raise your hand a week out instead of confessing on the deadline. Forecasting from your board turns “when will it be done?” from a dreaded question into a thirty-second answer you can stand behind.
The takeaway
You do not need a heavier process to answer the hardest scheduling question – you need to count. Track how many cards your team finishes each week, count what is left, divide, and quote a range instead of a single date. Keep cards roughly the same size and keep a lid on how much you start, and that range will hold up. It is honest, it takes seconds, and it is built on what your team truly does rather than what everyone wishes were true. And if all of this is living on a simple kanban board, the numbers you need are already sitting right there in front of you – waiting to be counted.