Ask most teams how long a piece of work takes and you will get a shrug and a guess. “A few days? Maybe a week?” Then the thing takes three weeks, the client is annoyed, and everyone quietly agrees that estimating is impossible. It is not impossible. You are just guessing when you could be measuring.
Your kanban board is already recording the answer. Every card that crosses it leaves a trail of timestamps, and from those you can pull two numbers that tell you the honest truth about how your work flows: lead time and cycle time. You do not need a data team or a fancy tool to use them. You just need to understand what each one means and what it is trying to tell you. Let us break it down.
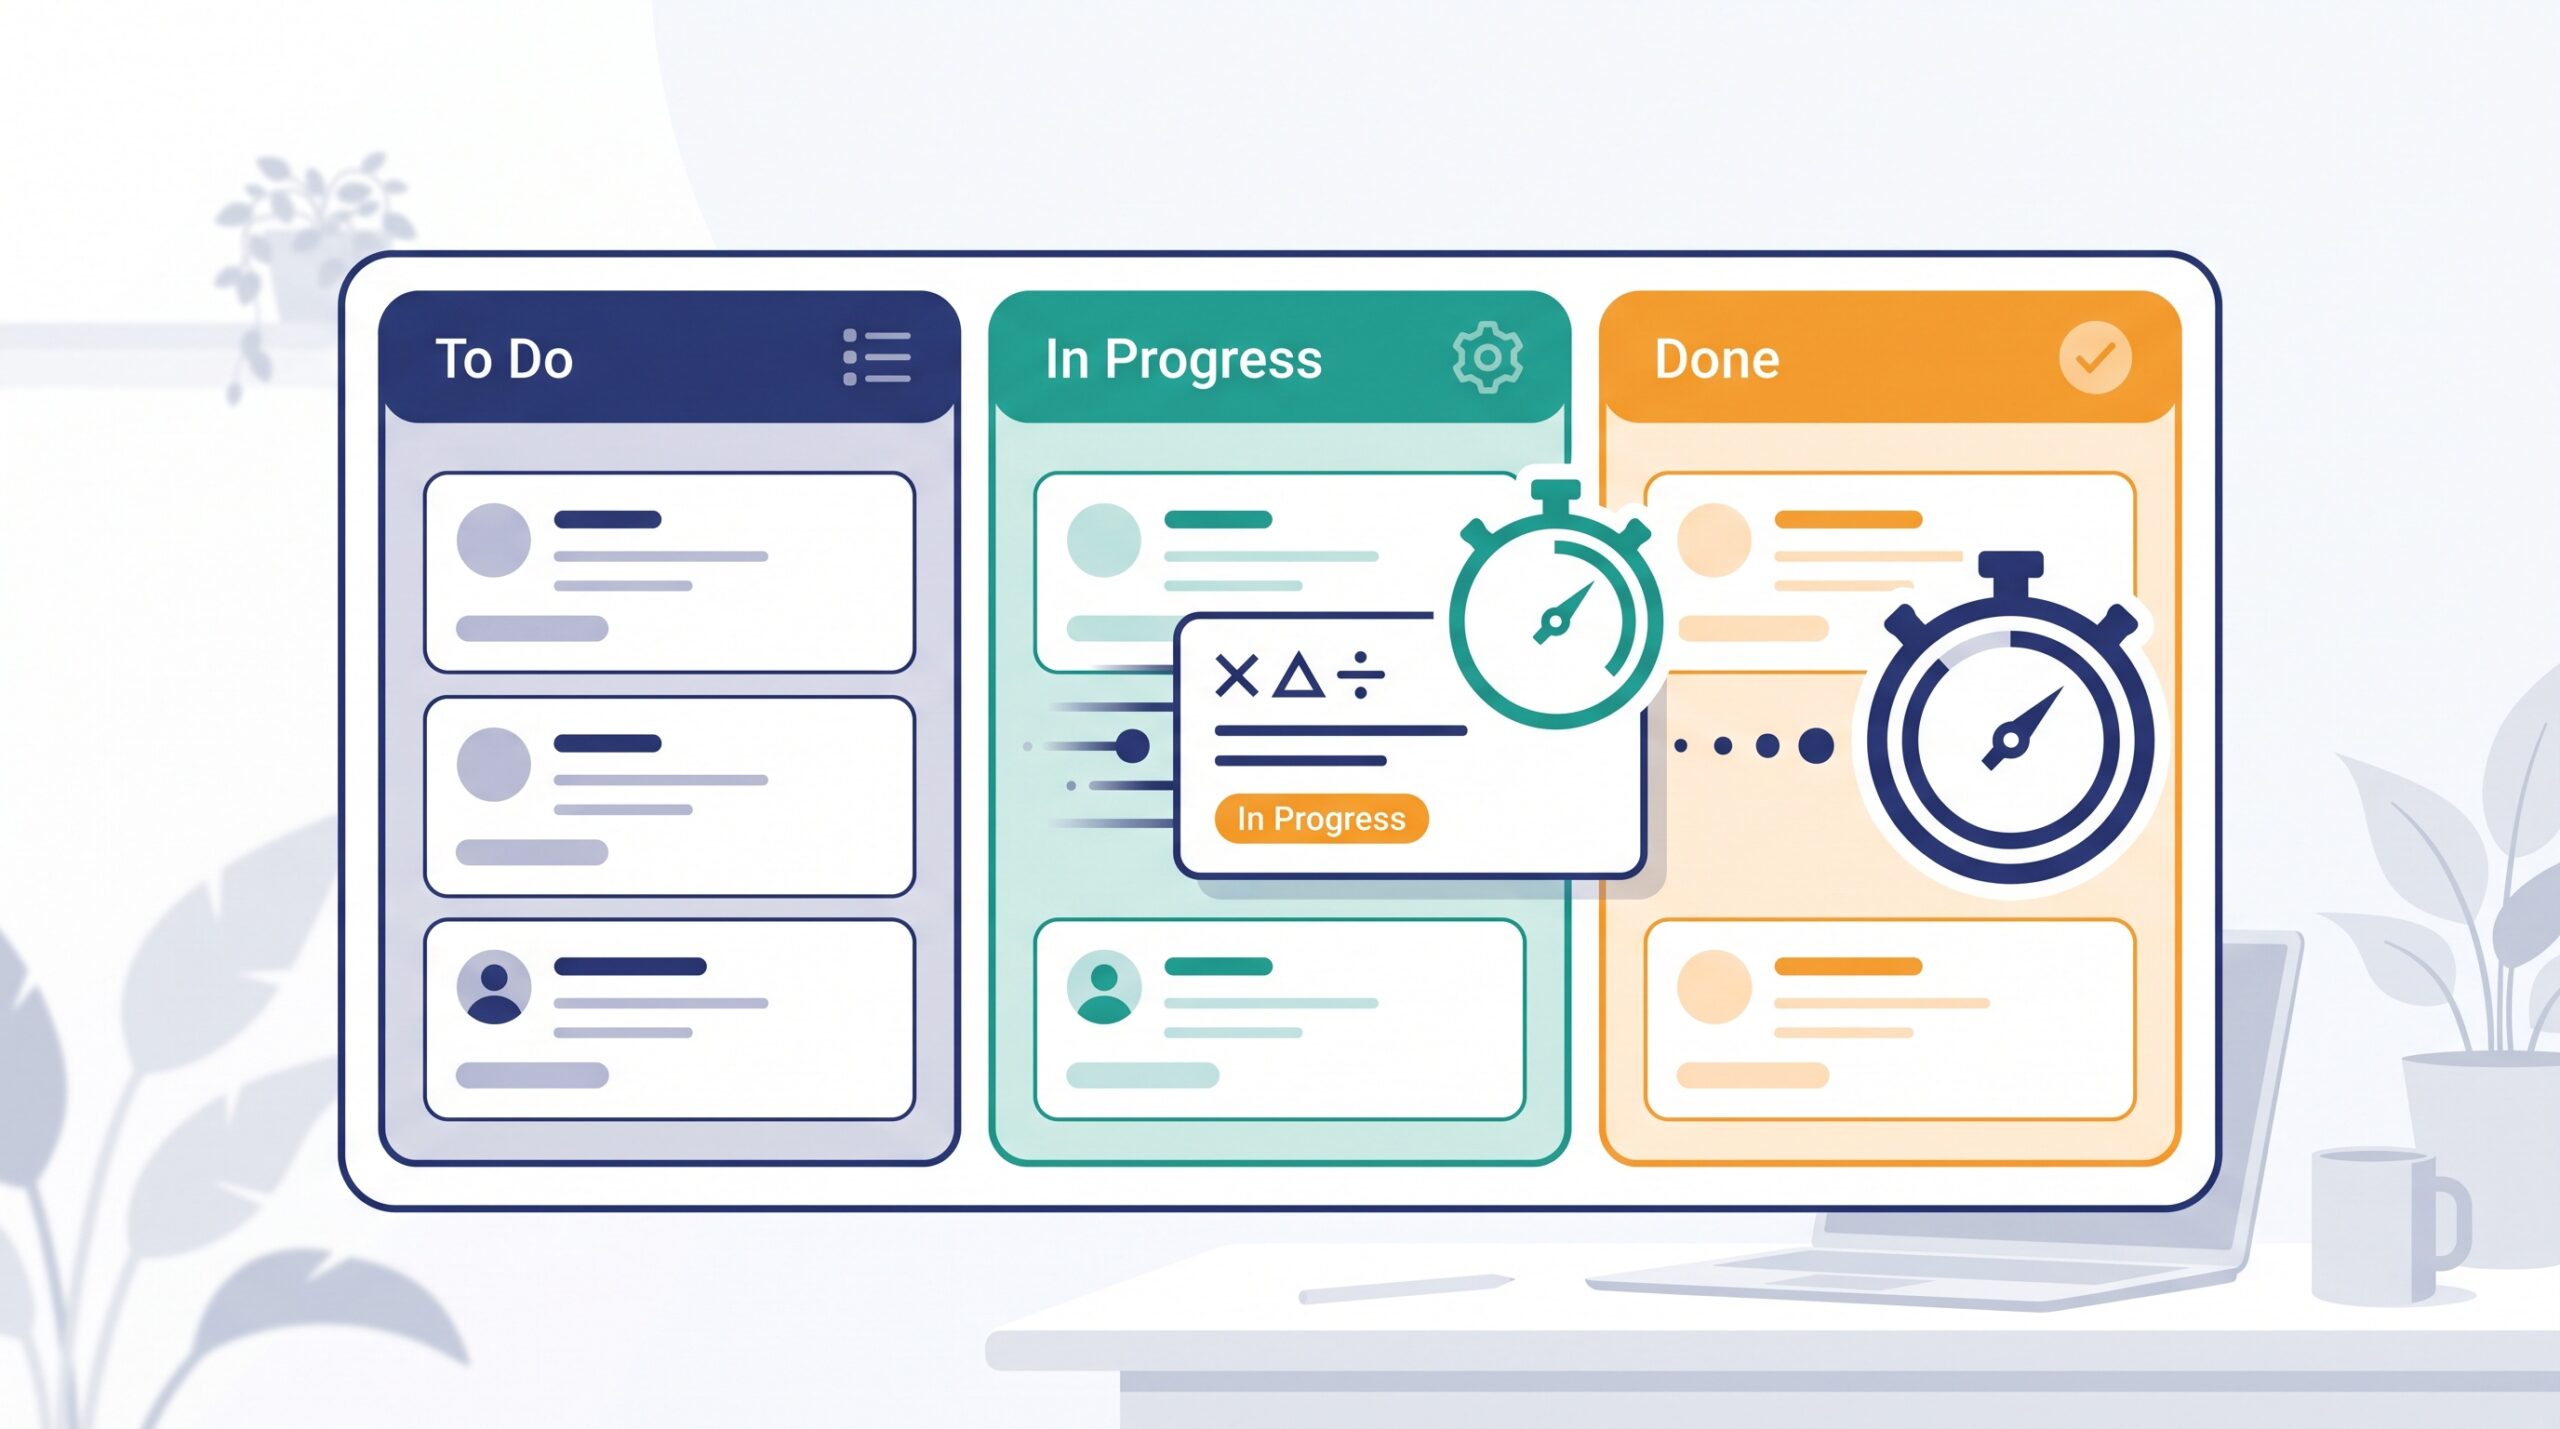
Lead time: the customer’s clock
Lead time is the whole journey. It starts the moment a request lands, the second someone asks for the thing, and it stops when that thing is done and delivered. It is the clock the customer or the requester actually feels, because it covers everything: the time the work sat in a queue waiting to be picked up, plus the time it took to actually do it.
Think of ordering food. Lead time is from the moment you place the order to the moment the plate hits your table. You do not care whether the kitchen was busy or the ticket sat on a rail for ten minutes. You care about the total wait. That is lead time, and it is what your reputation is built on, because it is what the person waiting experiences.
Cycle time: the team’s clock
Cycle time is narrower. It starts when someone actually begins working on the card, when it moves into your “In Progress” or “Doing” column, and it stops when the work is finished. It ignores all the time the card spent waiting in the backlog before anyone touched it.
Back to the kitchen: cycle time is from the moment the cook picks up your ticket to the moment the dish is ready. It measures how fast the work happens once it is actually being worked on. Cycle time is the team’s number. It reflects how you work, not how long the queue was.
The gap between them is where the truth hides
Here is why you want both, not just one. Subtract cycle time from lead time and you get the amount of time your work spent waiting, doing nothing, sitting in a queue for someone to get to it. For a lot of teams, that gap is enormous. A task that takes two days of actual work takes two weeks to deliver because it sat untouched for the first ten days.
That is a wildly useful thing to know. If your cycle time is short but your lead time is long, your problem is not that your team works slowly. It is that work is piling up faster than you can start it, or that too many things are in progress at once so new items wait their turn. You do not fix that by telling people to work harder. You fix it by starting fewer things and finishing them, or by clearing the queue. If you had only measured cycle time, you would have concluded the team was fast and missed the real delay entirely.

How to measure them without any fuss
You do not need special software. If your board records when cards move between columns, you already have the raw material. For any finished card:
Lead time equals the date it was done minus the date it was first requested or created.
Cycle time equals the date it was done minus the date it first moved into an active, being-worked-on column.
Grab your last ten or twenty completed cards, jot down both numbers for each, and you will have a real picture in about fifteen minutes. Do not obsess over a single card; look at the spread. You are after the typical range, not one heroic fast finish or one nightmare that dragged on for a month.
What to actually do with the numbers
Metrics you do not act on are just trivia. Here is where these two earn their keep.
Make promises you can keep. Once you know that most of your cards finish within, say, three to seven days of being started, you can quote a realistic window instead of a hopeful guess. “We usually turn this around in about a week” is a promise backed by evidence, and hitting it builds trust every single time.
Find your bottleneck. If lead time dwarfs cycle time, your work is waiting, not crawling. Look at where cards sit longest, often a queue before a single overloaded person or step, and attack that.
Spot trouble early. Watch these numbers over time. If cycle time is quietly climbing, something is changing, more complex work, interruptions, a person stretched too thin, and you can dig in before it becomes a crisis.
Sanity-check your workload. A long lead time is often just a sign you have said yes to too much at once. The fix is usually to limit how many things are in progress, so each finishes faster instead of everything inching along together.

A word of caution
Do not turn these into a stick. The fastest way to ruin good metrics is to start beating people over the head with them, because the team will simply game the numbers, marking things done that are not, or refusing to start anything hard. Cycle time and lead time are diagnostic tools, not performance scores. They are there to show you where the work gets stuck, not to rank the humans doing it.
Also resist the urge to average everything into a single tidy number and call it a day. The spread matters more than the average. Knowing that most cards finish in a week but one in five takes three tells you far more than a single blended figure ever could, because it is those slow outliers that blow up your promises.

Start this week
You do not need to overhaul anything. This week, when a card hits your Done column, note two dates: when it was first asked for and when work actually started. Do that for every finished card for a couple of weeks and you will have your own real cycle time and lead time, pulled straight from how your team actually works. From there you can make honest promises, find your real bottleneck, and stop guessing. A clean, current board is what makes those timestamps trustworthy, so keep it tidy and let the numbers do the talking.