Someone asks the question every team dreads: “So when will all of this actually be done?” You could guess. You could spend an afternoon assigning story points and arguing about them. Or you could use a formula that has been quietly reliable for a hundred years and needs only two numbers you can read straight off your board.
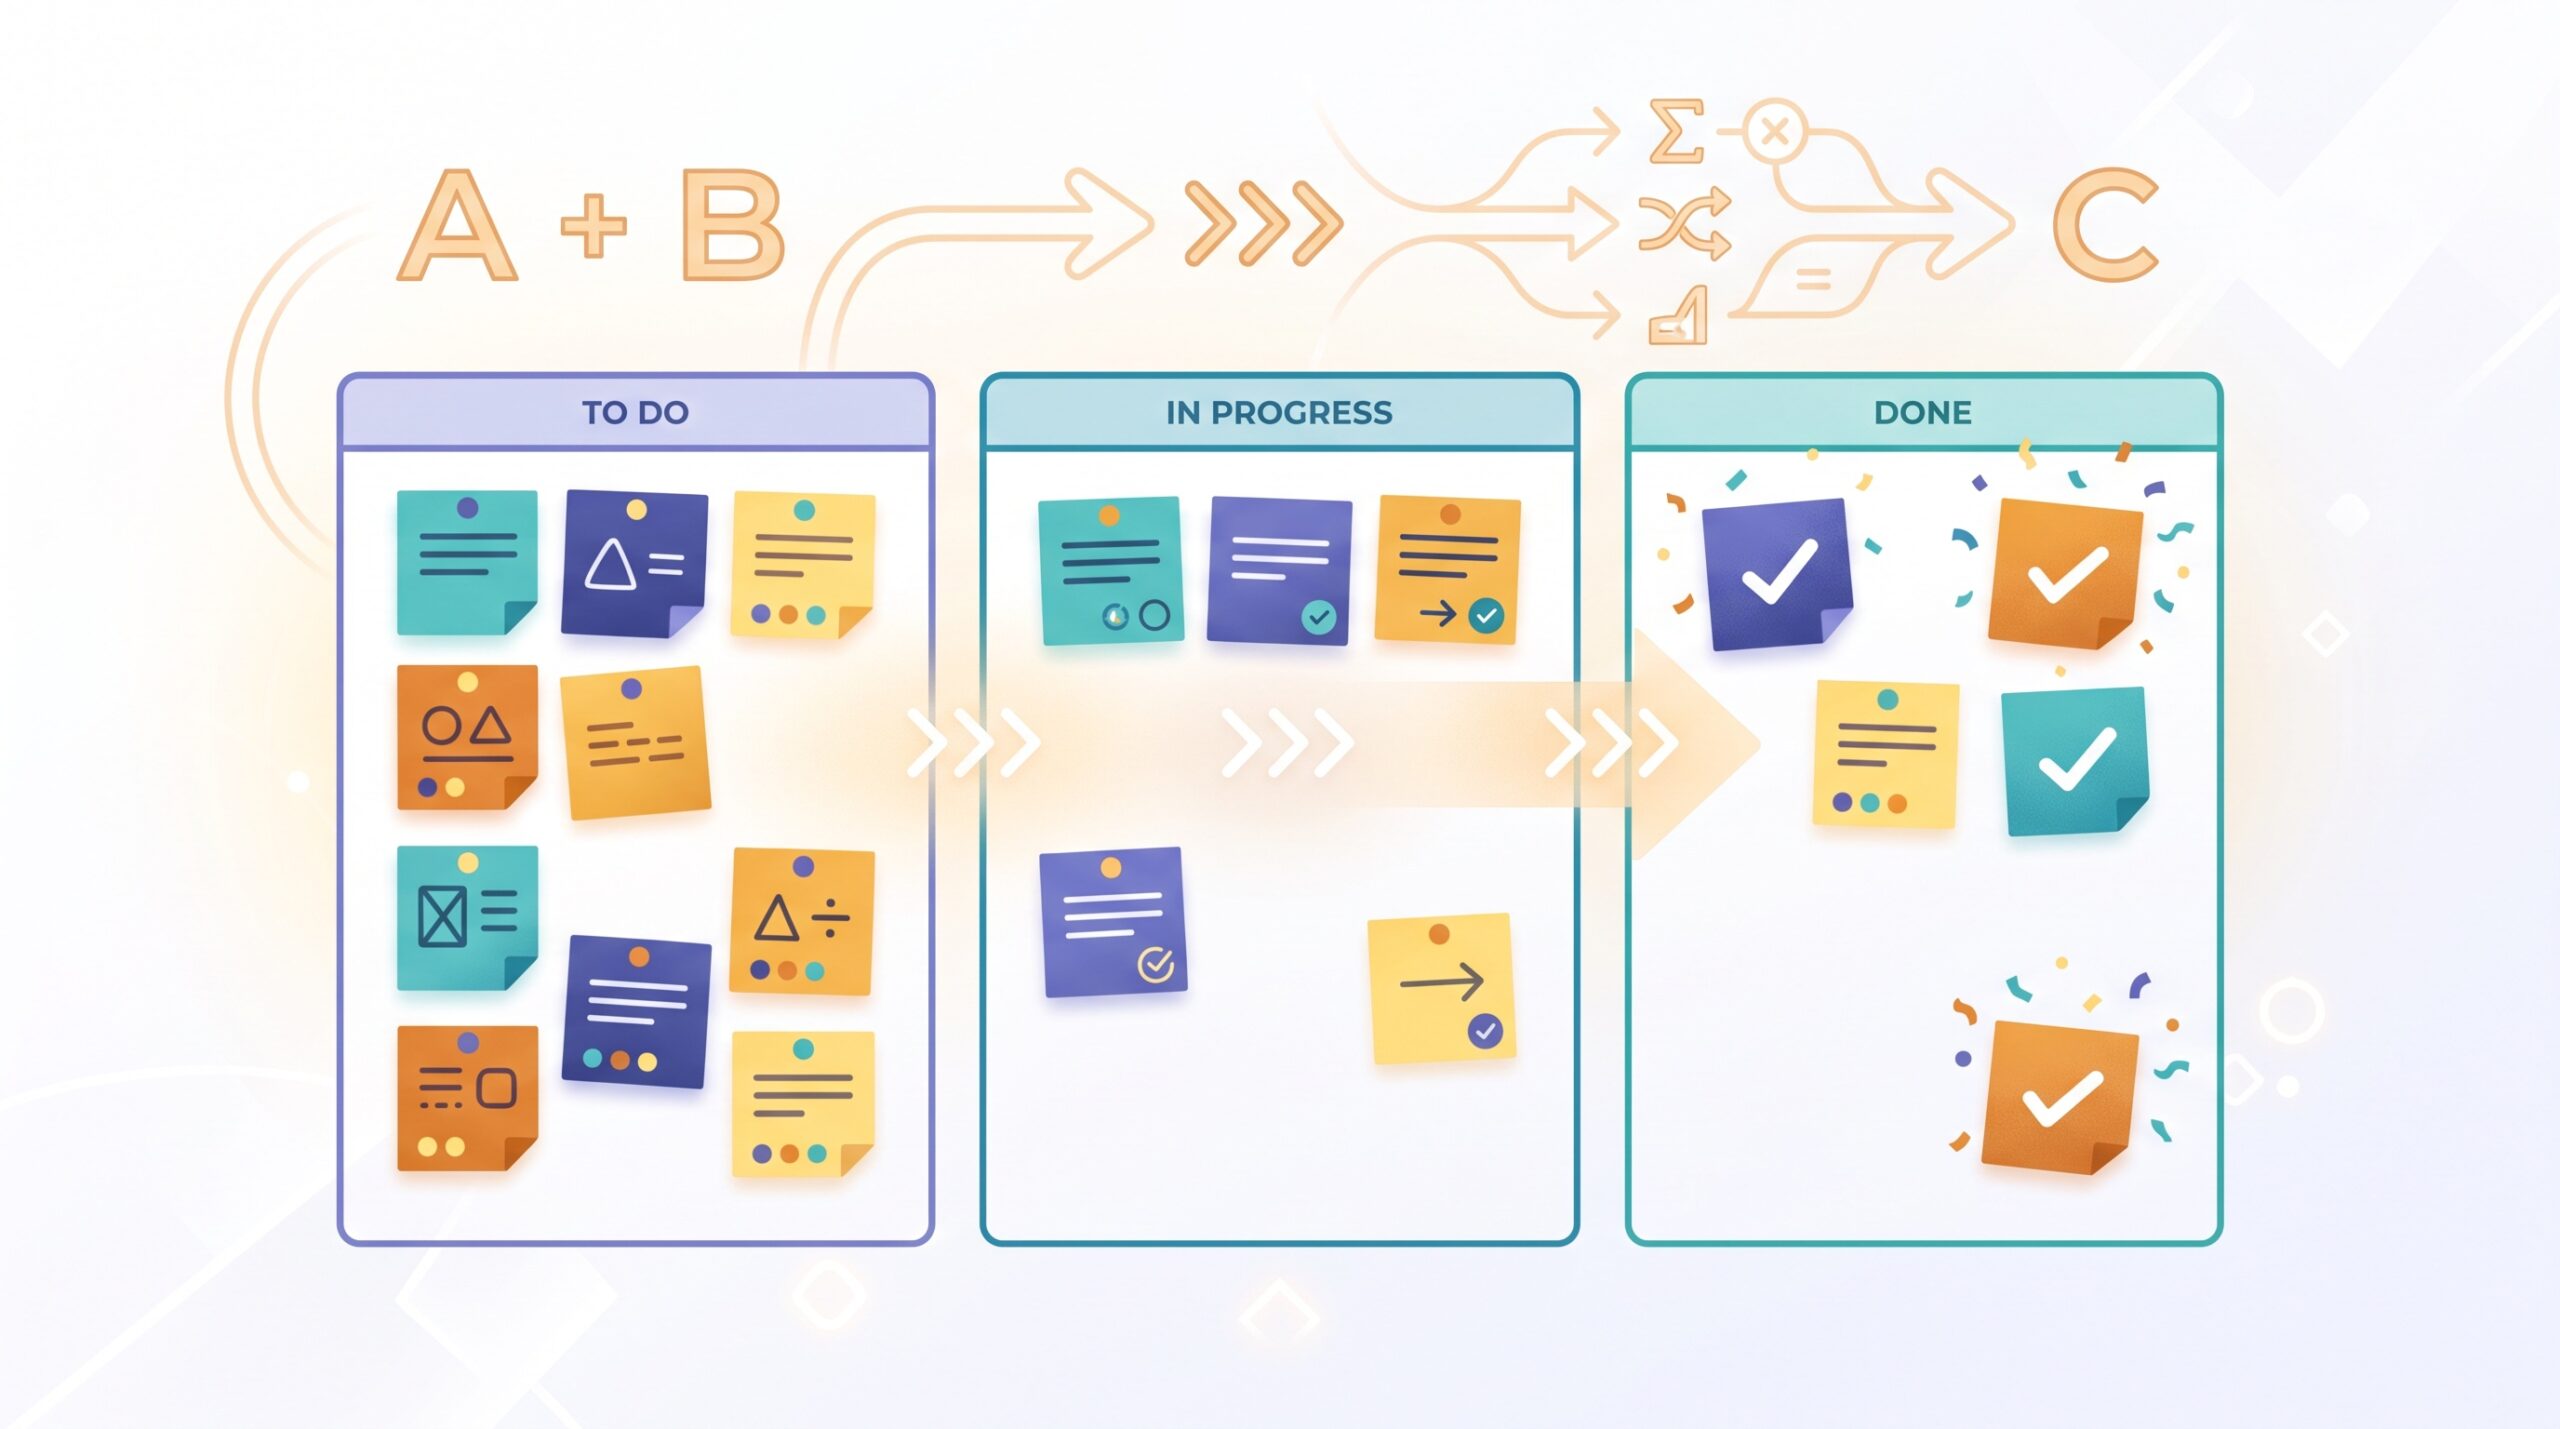
The whole law, in one line
Little’s Law says that, on average, the time an item spends in your system depends on just two things: how much work is in the system, and how fast work leaves it. Written plainly:
Average cycle time = Work in progress ÷ Throughput
That’s it. Cycle time is how long a single card takes from “started” to “done.” Work in progress (WIP) is how many cards are in flight right now. Throughput is how many cards you finish in a period — say, per week. Rearrange the same equation and you can forecast a whole backlog instead of one card.
A worked example you can copy
Say your board currently has 10 cards in progress, and over the last several weeks your team has consistently finished 5 cards per week. Little’s Law gives you:
Cycle time = 10 ÷ 5 = 2 weeks for a typical card to clear.

Now the useful version. A client asks how long a 30-card backlog will take. If you keep finishing about 5 cards a week, then 30 ÷ 5 = six weeks. No estimation meeting, no points poker — just the rate you already deliver at. That number is honest in a way a gut guess never is, because it’s built from what your team actually does, not what it hopes to do.
Why piling on more work backfires
Here is the insight that makes Little’s Law more than arithmetic. Look at the formula again: if throughput stays the same but WIP goes up, cycle time goes up with it. Start 20 cards instead of 10 at the same delivery rate, and the average card now takes four weeks instead of two.
This is the mathematical proof behind something you’ve felt in your gut: taking on more at once doesn’t get things done faster — it makes everything finish later. A busy board isn’t a productive board; it’s a slow one. The lever that actually speeds delivery is limiting how much you start, so that cards flow through instead of stacking up.
Getting numbers you can trust
The law is only as good as your inputs, so a few ground rules:
- Count throughput over a real stretch — four to eight weeks — so one slow week doesn’t skew it. Use the average.
- Count WIP honestly. Everything that’s genuinely started counts, including the “almost done” cards that have sat for days.
- Keep card sizes roughly comparable. The law works on averages; if one card is a five-minute fix and another is a month-long project, break the giant one down so your average means something.
- Treat it as a forecast, not a promise. It tells you the likely neighborhood, not a guaranteed date. That’s still miles better than a hopeful guess.
Using it in real conversations
The quiet power of Little’s Law is that it reframes planning arguments as math. When a stakeholder wants to add “just one more urgent thing,” you can show that doing so pushes the delivery date for everything else — and roughly by how much. When someone asks for a date, you give a range grounded in your real throughput instead of a number you’ll regret. And when the team wants to go faster, the formula points at the honest answer: either finish work more quickly, or start less of it at once.
The takeaway
You don’t need heavyweight estimation to answer “when will this be done.” Track two numbers — how many cards are in progress and how many you finish per week — and Little’s Law does the rest. Keep your work-in-progress low so cards flow instead of piling up, measure your real throughput, and you’ll trade anxious guessing for forecasts you can actually defend. A board with sensible column limits isn’t just tidier; it’s the fastest version of itself — and the math is right there to prove it.