Try this with your team on a Friday: ask how much you got done this week. You’ll almost never get a number. You’ll get a feeling – “we were slammed,” “pretty good week,” “total chaos” – or a story about the one big thing that went sideways. Feelings and stories are fine, but they’re a shaky basis for deciding whether you can take on a new client, promise a deadline, or hire.
There’s a simpler answer sitting on your board right now, and it’s just a count: how many things did you actually finish? That number is called throughput, and it’s the plainest, most honest measure of how much your team really ships.
What throughput actually is
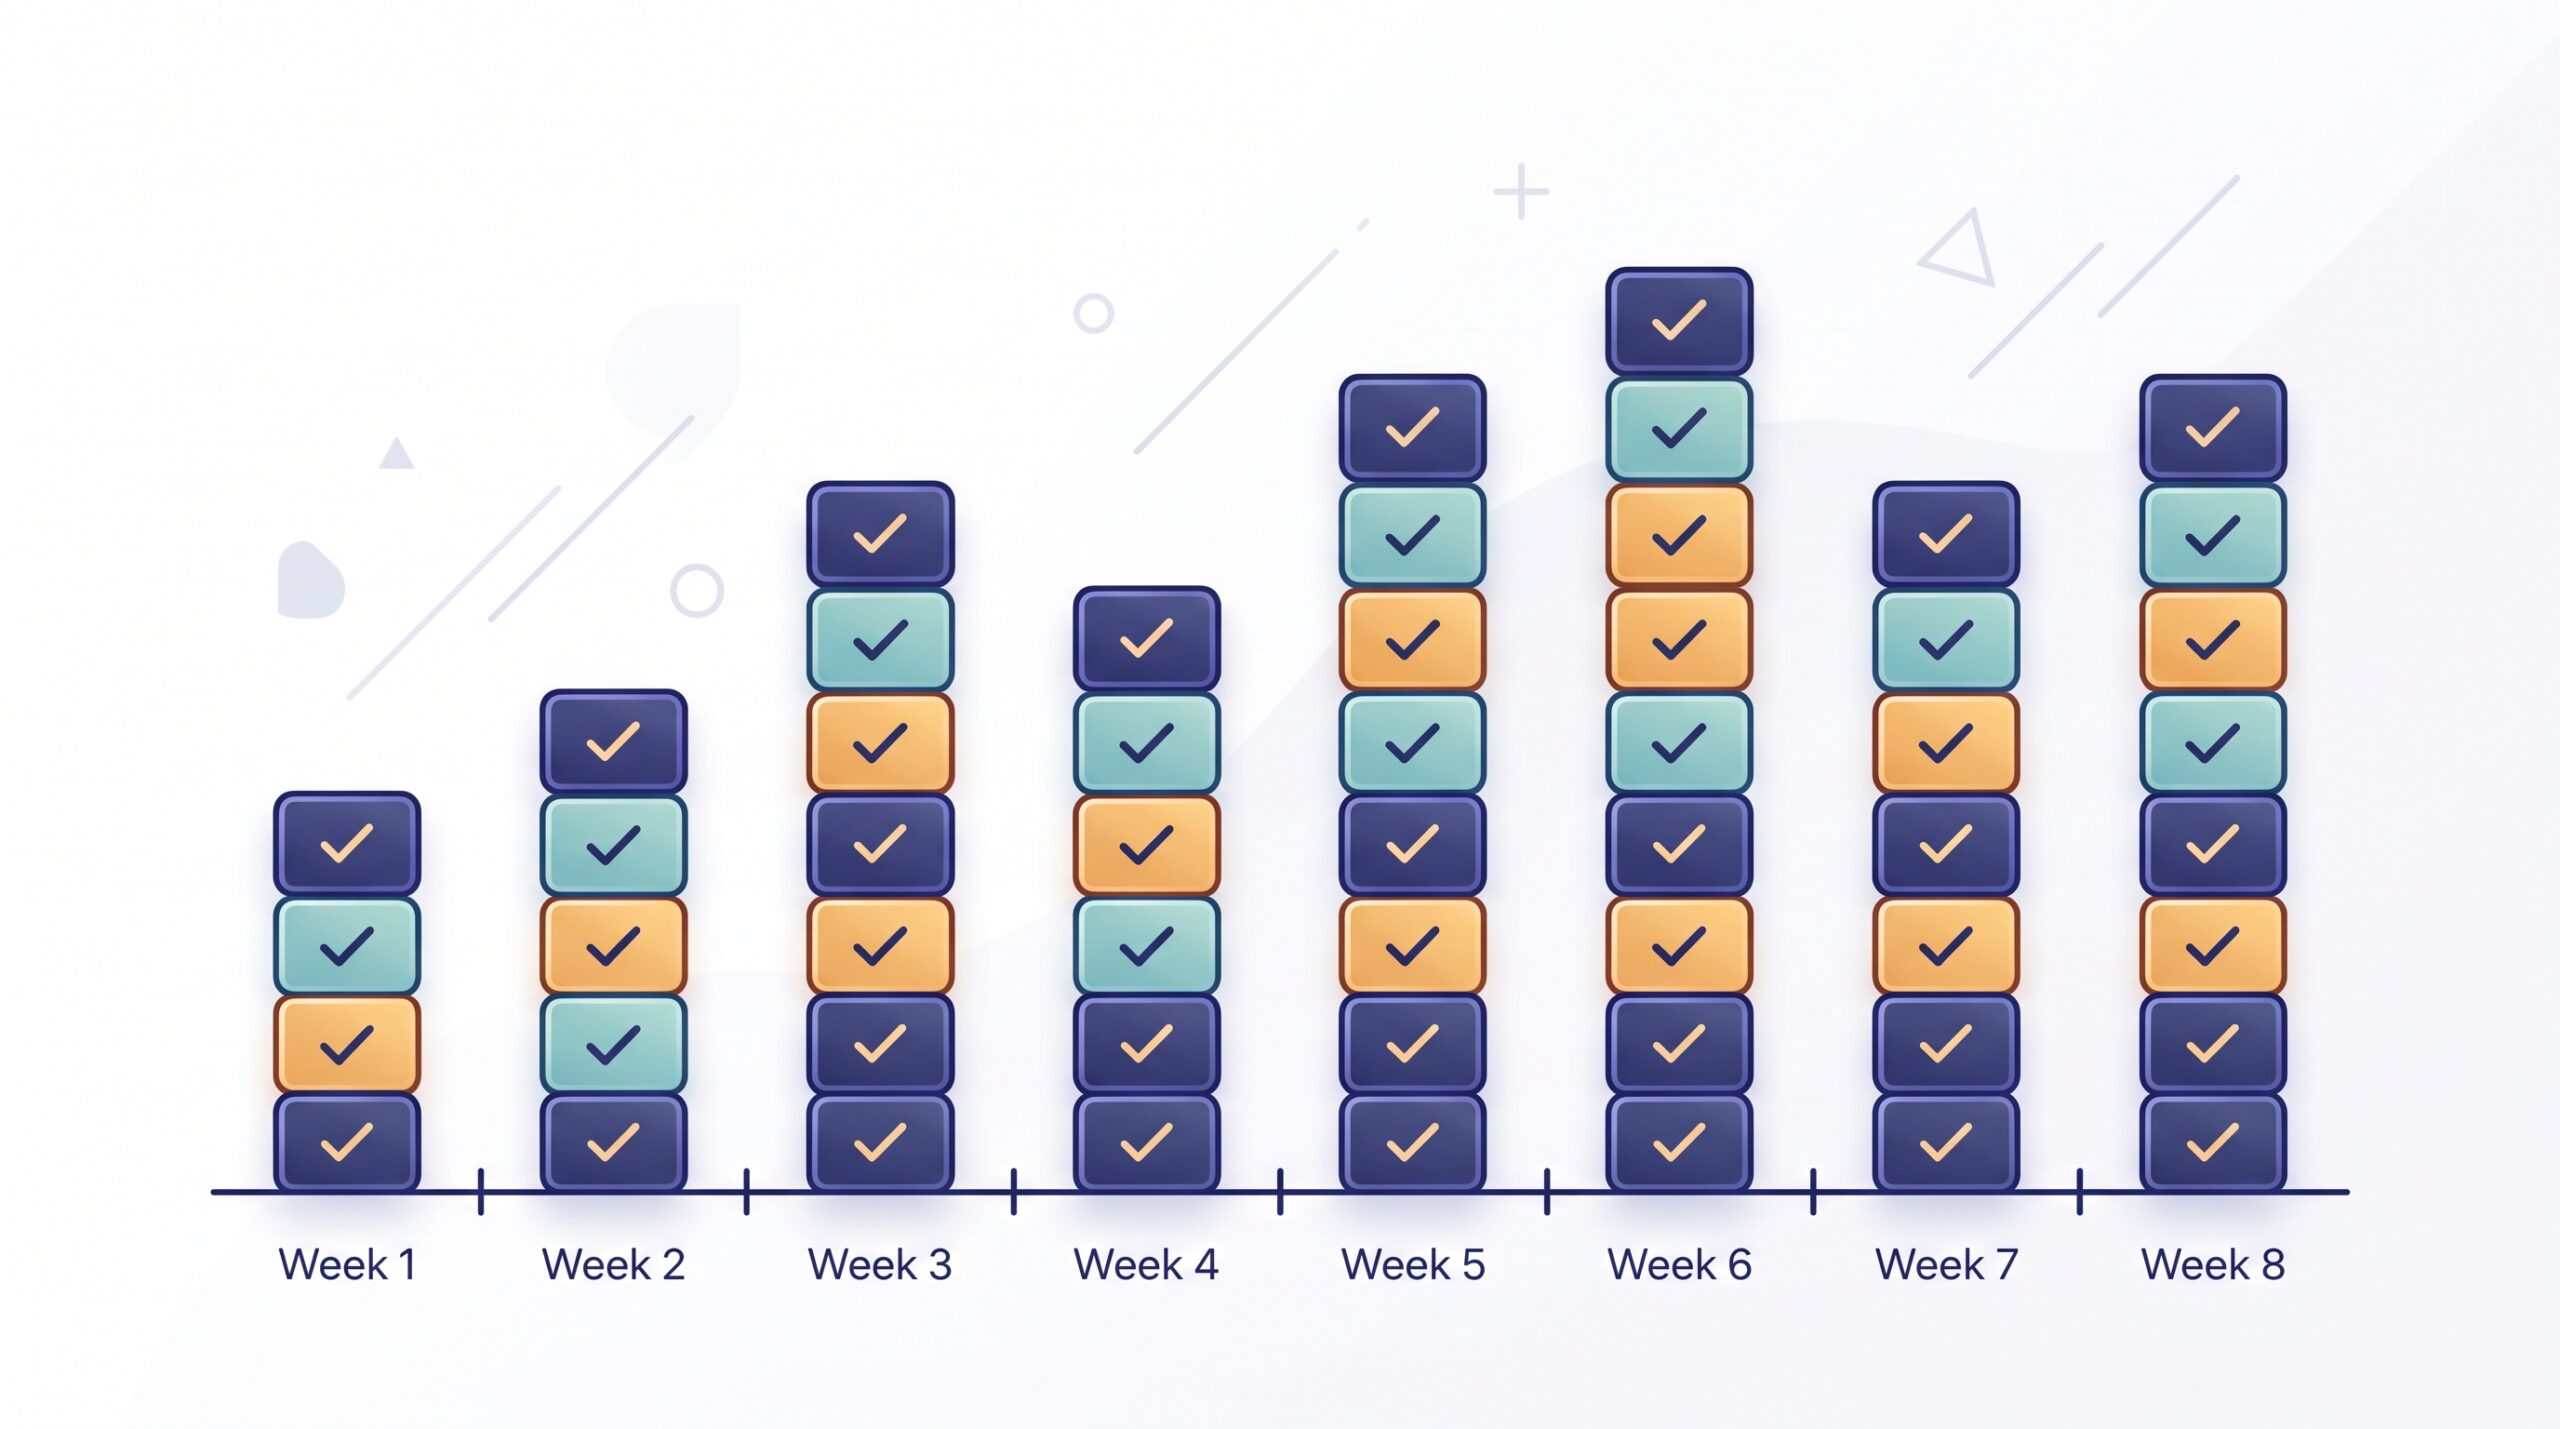
Throughput is the number of work items you complete in a set period – usually a week. If your board moved eleven cards into Done this week, your throughput for the week was eleven. That’s the whole definition. No story points, no complicated formula, no estimation ritual. You count the cards that crossed the finish line.
The reason this matters is that most teams measure the wrong thing. They track how busy they are – hours worked, tasks started, meetings attended – when the only thing a customer or a boss ever sees is what actually got finished. A team can be frantically busy and ship almost nothing, or calm and steady and ship a lot. Throughput cuts straight through the noise: started doesn’t count, in-progress doesn’t count, only done counts.
How to measure it (this takes five minutes)
You don’t need a tool or a dashboard to start. Once a week, at the same time – Friday afternoon works well – look at your Done column and count the cards that landed there since last Friday. Write the number down somewhere you’ll keep it. Next week, do it again. That’s it.
After a month you’ll have four numbers, maybe something like 9, 12, 7, 11. Already that’s more useful than any gut feeling, because now you can see a range. Your team finishes somewhere around seven to twelve things a week. That single fact quietly answers a lot of questions you used to guess at.
Throughput isn’t the same as speed
It’s worth being clear about what throughput does and doesn’t tell you, because it’s easy to confuse it with how fast individual work moves. Throughput is about volume out the door – how many finished items per week. How long a single item takes to travel across the board is a different measurement, and we walk through that one in cycle time and lead time.
The two work together. A rising throughput with a steady cycle time is a genuinely healthier team. But throughput on its own can be misleading if you’re only finishing small, easy things while the hard work quietly piles up. It also won’t tell you where work is getting stuck – for that you’re looking for the pile-up point, which is the job of finding the bottleneck on your board. Throughput tells you how much you ship; those other numbers tell you why.
The honest limitation: not all cards are equal
Here’s the objection everyone raises, and it’s a fair one: a two-minute password reset and a three-week product build both count as “one” when you tally the Done column. Doesn’t that make the number meaningless?
Not really – but you have to read it right. Over a single week, an unusual pile of tiny tasks can inflate the count. Over several weeks, that noise mostly averages out, because most teams have a fairly consistent mix of big and small work. The trend across a month tells the truth even when any one week is skewed.
The bigger the range in your card sizes, the noisier the number. So the real fix isn’t to abandon throughput – it’s to keep your cards roughly comparable in size by breaking the giant ones down. Right-sizing work makes throughput more meaningful and makes the work flow better, which is a nice two-for-one.

Steady beats high
Once you’ve got a few weeks of numbers, the most useful thing to look at isn’t how high they are – it’s how consistent they are. A team that reliably finishes ten things a week is far easier to run than one that finishes twenty, then three, then fifteen. Predictability is what lets you make promises you can actually keep.
If your throughput swings wildly week to week, that’s a signal worth chasing. Usually it means work is arriving or being started in uneven bursts, or that a few oversized items are clogging things and then dumping all at once. A steady intake and consistent card sizes smooth the line out. This is also the foundation for answering the question every client and boss eventually asks – when will it be done? – because a stable throughput lets you forecast honestly without a single story point.
What to do with the number
Throughput earns its keep the moment you use it to make a decision instead of a guess. A few of the practical ones:
- Setting expectations. If you finish about ten items a week and someone drops fifteen new must-haves on you, you now have a factual, non-defensive answer about what’s realistic – not an argument, just arithmetic.
- Spotting trouble early. A throughput that quietly drifts down over a few weeks is often the first hard evidence of a problem – a bottleneck forming, too much unfinished work in flight, or the team drowning in interruptions – long before anyone would have raised their hand.
- Sizing new commitments. Thinking about taking on a bigger client or a new line of work? Your throughput is a reality check on whether you have the capacity or whether you’re about to overload a team that’s already full.
Notice what’s not on that list: ranking individuals. Throughput is a measure of the system – the whole board’s output – not a scoreboard for who finished the most cards. The moment you use it to compare people, they’ll start gaming it by grabbing easy work, and your number will lie to you. Keep it about the team.

Getting started this week
You don’t need to overhaul anything. If you already run a board, you’re one Friday count away from having this. Look at your Done column, count what finished this week, write it down, and repeat. Four weeks from now you’ll have something most small teams never do: a clear, honest picture of how much you actually ship – not how busy you felt.
A simple kanban board makes this almost automatic, because the finished work is already collected in one place instead of scattered across inboxes and heads. Let the Done column do the counting for you, watch the trend rather than any single week, and let a plain number replace the Friday shrug.