Here’s a small experiment that changes how you see your workload. Pick a task that recently took a week to finish, and ask yourself an honest question: how many hours did someone actually spend working on it? Not waiting for feedback, not sitting in a queue, not blocked on someone else – just hands-on, moving-it-forward work. For most tasks the answer is jarring. A card that lived on the board for five days often held only a few hours of real effort. The rest was waiting.
That gap has a name. It’s called flow efficiency, and it might be the most useful number your team isn’t tracking.
What flow efficiency actually measures
Flow efficiency is a simple ratio: the time a task spends being actively worked on, divided by the total time it spent on the board from start to finish. Multiply by 100 and you get a percentage.
Say a client request took eight working days to complete, but the actual design, writing, and review added up to about a day and a half of effort. That’s roughly 1.5 divided by 8, or about 19% flow efficiency. Nineteen percent. The other 81% of that task’s life was spent doing nothing at all – waiting for a reply, waiting for a review, waiting for the person ahead in line to free up.
The reason this matters is that most teams try to go faster by working harder on the 19%. They ask people to type quicker, skip breaks, or multitask. But the real opportunity is hiding in the 81%. If you can’t easily make the work itself faster, you can almost always make it wait less.
Why the number is usually so low
When teams measure this for the first time, the result is almost always lower than they expect. Flow efficiency of 15% to 40% is completely normal for knowledge work – marketing tasks, client projects, software, admin. Even well-run teams rarely crack 40%.
That’s not a sign your team is lazy. It’s a sign that work naturally spends most of its life in a queue. Every time a task changes hands, needs an approval, or depends on something else, it stops moving. Those pauses are invisible on a to-do list, because a to-do list only shows whether something is done or not done. It never shows the difference between “being worked on” and “just sitting there.”

Where the waiting actually hides
Once you start looking, you’ll spot the same culprits over and over. Naming them is half the battle:
- Handoffs. Whenever work passes from one person to another, it lands in that person’s queue and waits its turn. A task touched by three people gets three chances to sit idle.
- Approvals and feedback. “Waiting for the client to sign off” and “waiting for a review” are usually the single biggest chunks of wasted time.
- Blockers. A missing file, an unanswered question, a dependency on another project – each one freezes the card until someone unfreezes it.
- Too much started at once. When everyone has ten things open, each thing gets a few minutes of attention and then goes back to waiting while attention shifts elsewhere.
How to measure it without a stopwatch
You do not need time-tracking software or a stopwatch for every card. A kanban board gives you most of the picture for free, if you set it up to separate doing from waiting.
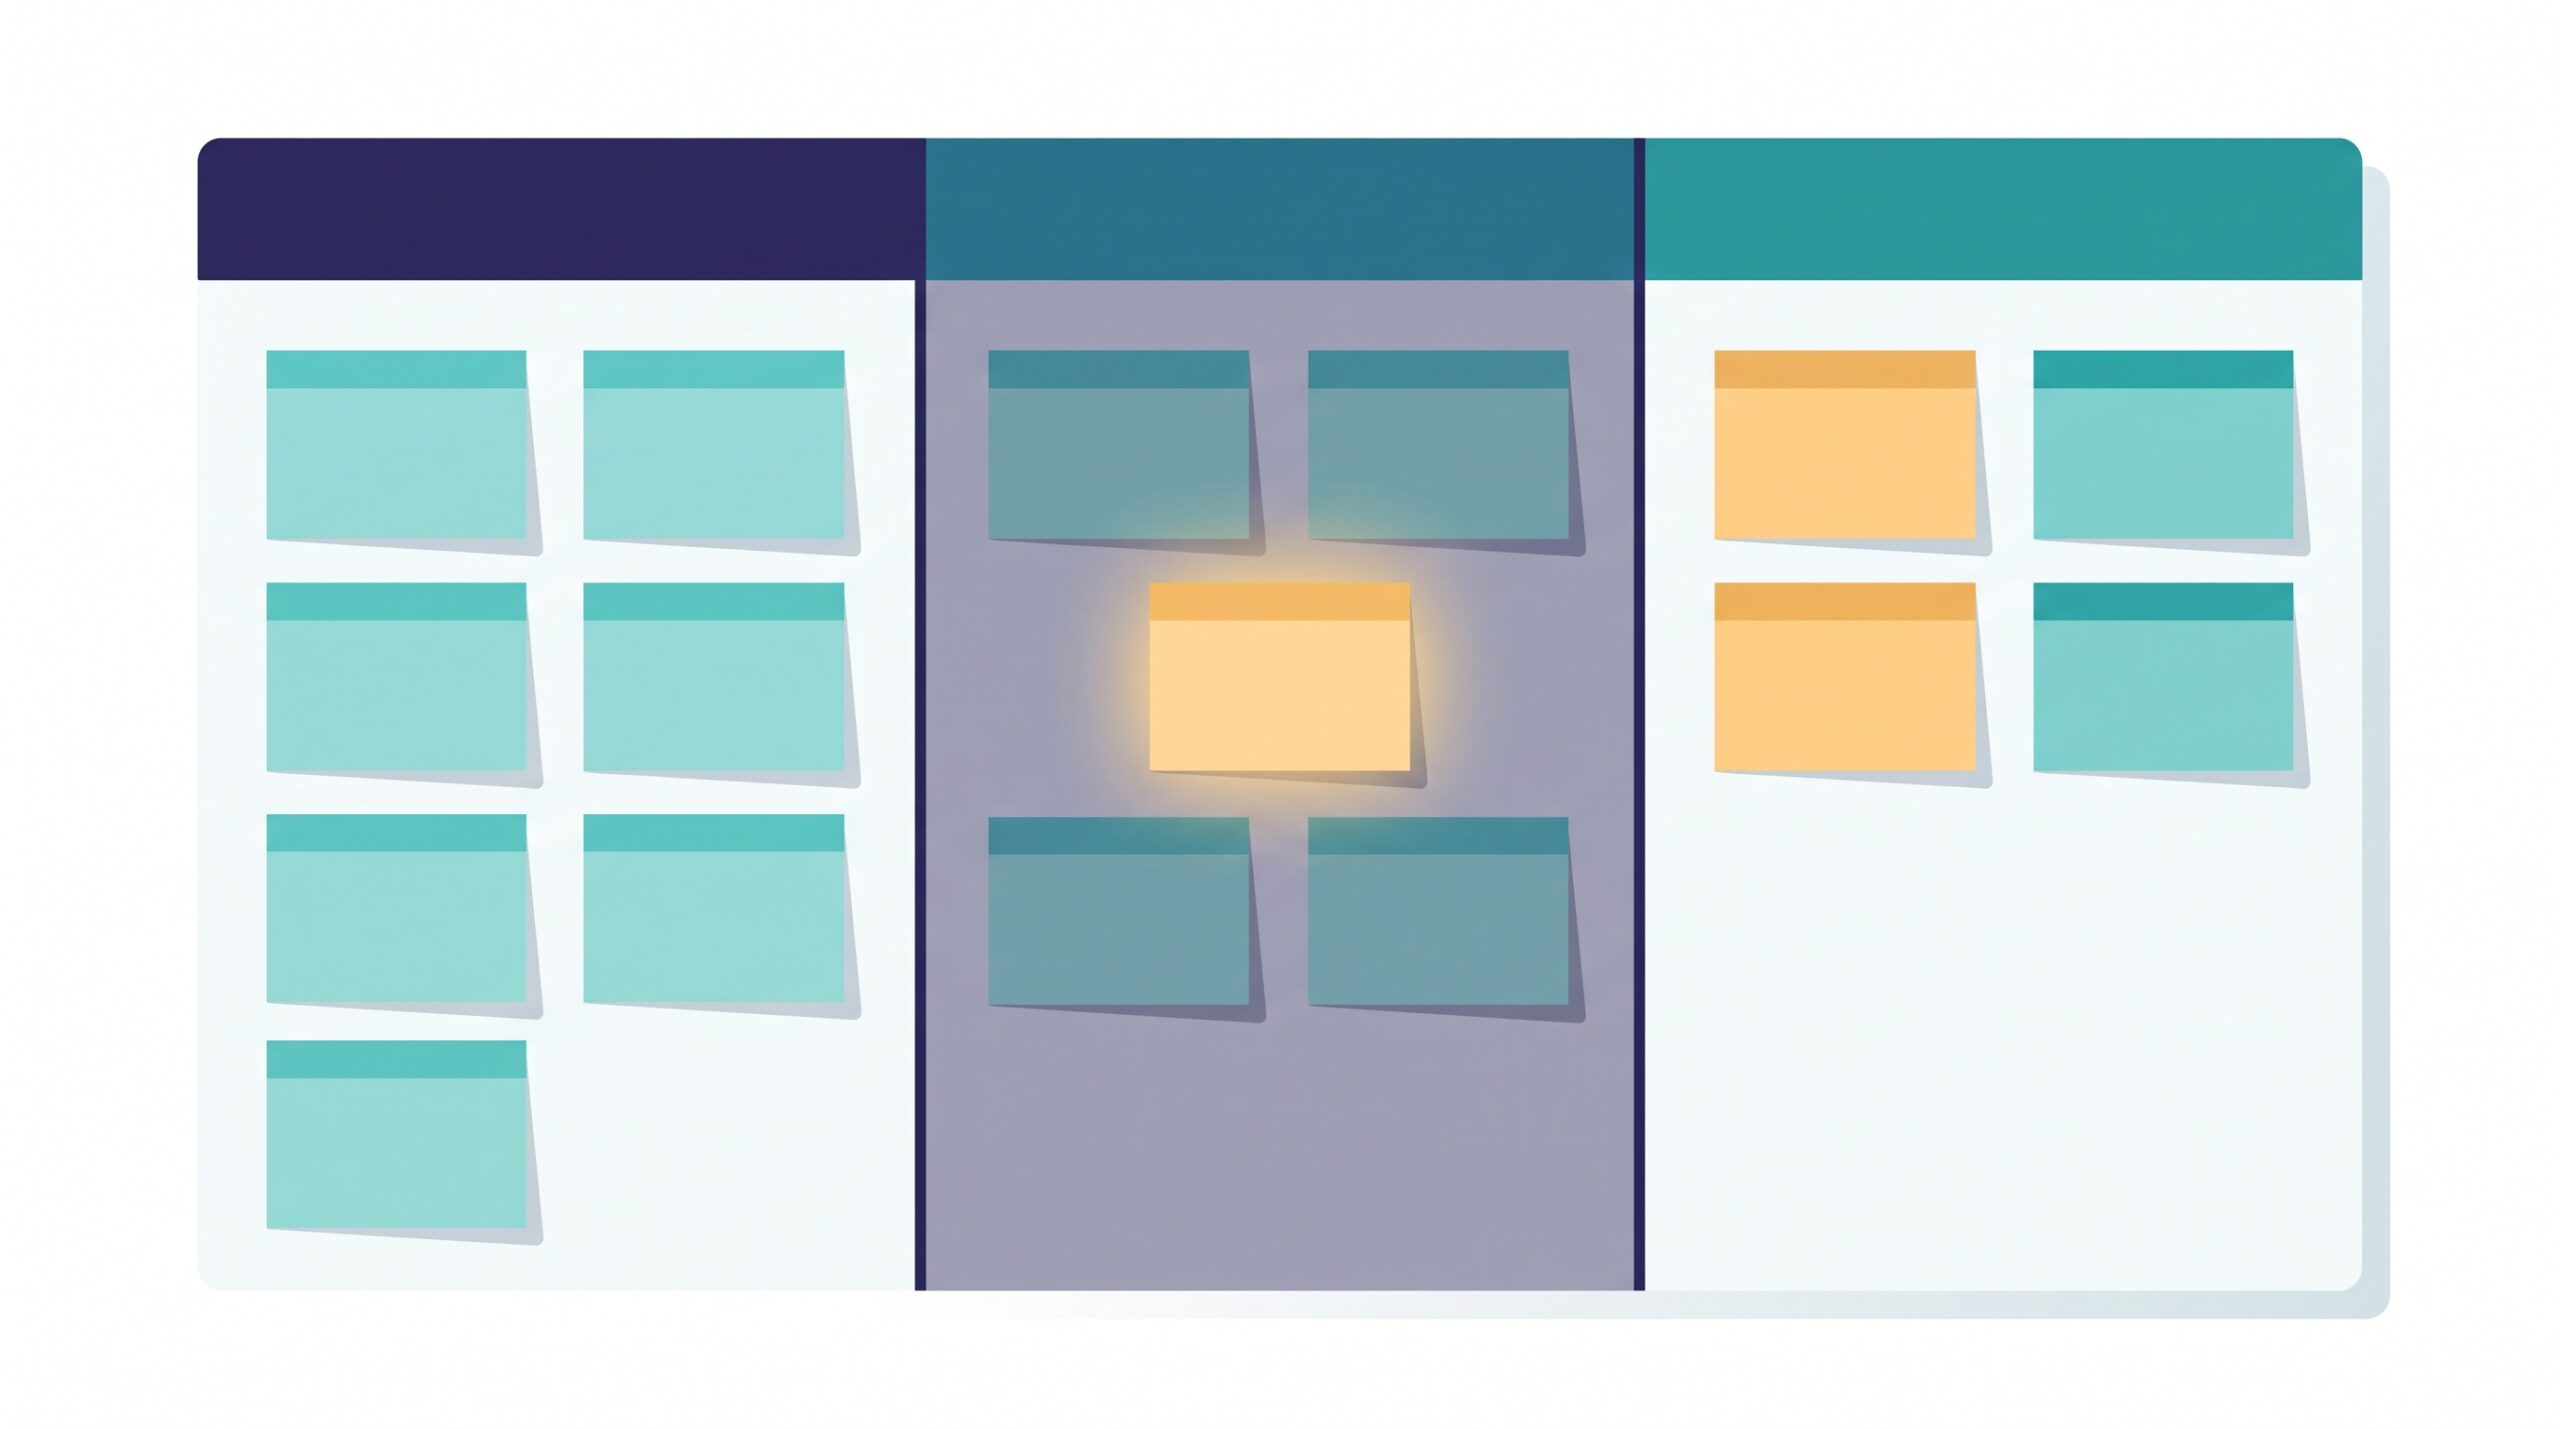
The trick is to split your board into columns that show active work versus waiting. Instead of one big “In Progress” column, use pairs: a “Doing” column and a “Ready / Waiting” column beside it. When a designer finishes and hands off to a writer, the card moves into “Ready for Writing” and sits there visibly until the writer pulls it. Suddenly the waiting is on the board instead of hidden inside a single column.
Now you can estimate flow efficiency by eye. Count the cards sitting in “waiting” columns versus the ones in “doing” columns. If your board is mostly waiting cards – and it usually is – you’ve found your bottleneck without a single spreadsheet. For a rough number, take one finished task, look at how long it lived on the board, and subtract the days it was clearly parked in a waiting or blocked state. What’s left is your active time.
Simple ways to raise the number
The good news is that flow efficiency responds quickly to a few unglamorous changes. You don’t need to work faster – you need to remove the pauses.
Limit how much is in progress. This is the biggest lever by far. When a team caps the number of open tasks, work stops piling up in queues and starts flowing through. Fewer things started at once means each thing finishes sooner, even though nothing about the actual work changed.
Attack the waiting columns, not the doing columns. If cards pile up in “Waiting for Review,” the fix isn’t faster designers – it’s a faster review habit. Book a short daily review slot, or agree that reviews happen within four hours. Small policies like this shrink the biggest slices of dead time.
Reduce handoffs. Every handoff adds a queue. Where you can, let one person carry a task further before passing it on, or bring reviewers into the work earlier so approval isn’t a separate stage at the end.
Make blockers loud. Mark blocked cards clearly and talk about them first in your standup. A blocker that everyone can see gets cleared in hours; one that’s buried gets cleared in days.

Pick a realistic target, not a perfect one
Here’s the trap to avoid: don’t chase 100%. A card can’t be worked on every single minute, and trying to force it there leads to burnout and cut corners. Some waiting is healthy – a review genuinely improves the work, and a little slack keeps people sane.
A far better goal is steady improvement. If you’re at 20% today, getting to 30% roughly means your team delivers the same work in two-thirds of the time – a massive win that customers feel directly. Measure a handful of tasks, make one change, and check again in a few weeks. You’re not aiming for perfection; you’re aiming for less waiting than last month.
The takeaway
Most work isn’t slow because it’s hard. It’s slow because it waits. Flow efficiency simply makes that waiting visible, and once you can see it, you can shrink it. A few habits do most of the work:
- Split “in progress” into doing and waiting so idle time stops hiding.
- Cap how much is open at once – this alone moves the number the most.
- Fix the fattest waiting column first, whether that’s reviews, approvals, or handoffs.
- Aim for steady gains, not a perfect score.
You don’t need new tools or a bigger team to do this – just a board that shows you the truth about where your work spends its time. A simple kanban board, with waiting made visible, is often all it takes to find the days you didn’t know you were losing.
Sources & further reading:
- The kanban way: how to visualize progress and data in Trello
- 8 Popular Project Management Tools and What They’re Useful For – Coursera